Spatial maps for publication and degree purposes
Since 2017, I have applied my knowledge of geographic information systems (GIS) to design maps for numerous students and researchers in the university's research unit, enhancing my mapping workflow to deliver engaging and informative maps.
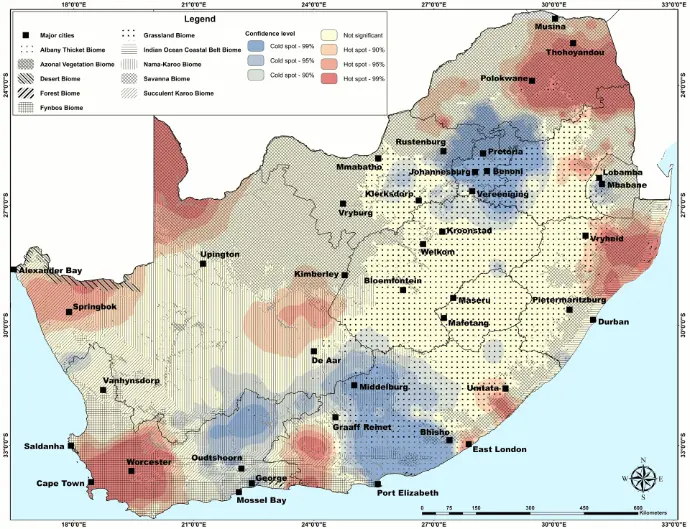
Occurrence hotspot maps
Client: Researchers
Objective: To develop a hotspot map showcasing the distribution of rare and common praying mantid species across South Africa, using occurrence data from museum archives, GBIF, and the researcher’s own fieldwork. To incorporate biome symbols to illustrate regional ecological variance in the map.
Outcomes:
- Created maps to illustrate various geographic and ecological features
- Produced interpolation maps to visualise biodiversity data
- Sourced and compiled GIS datasets to support research outputs
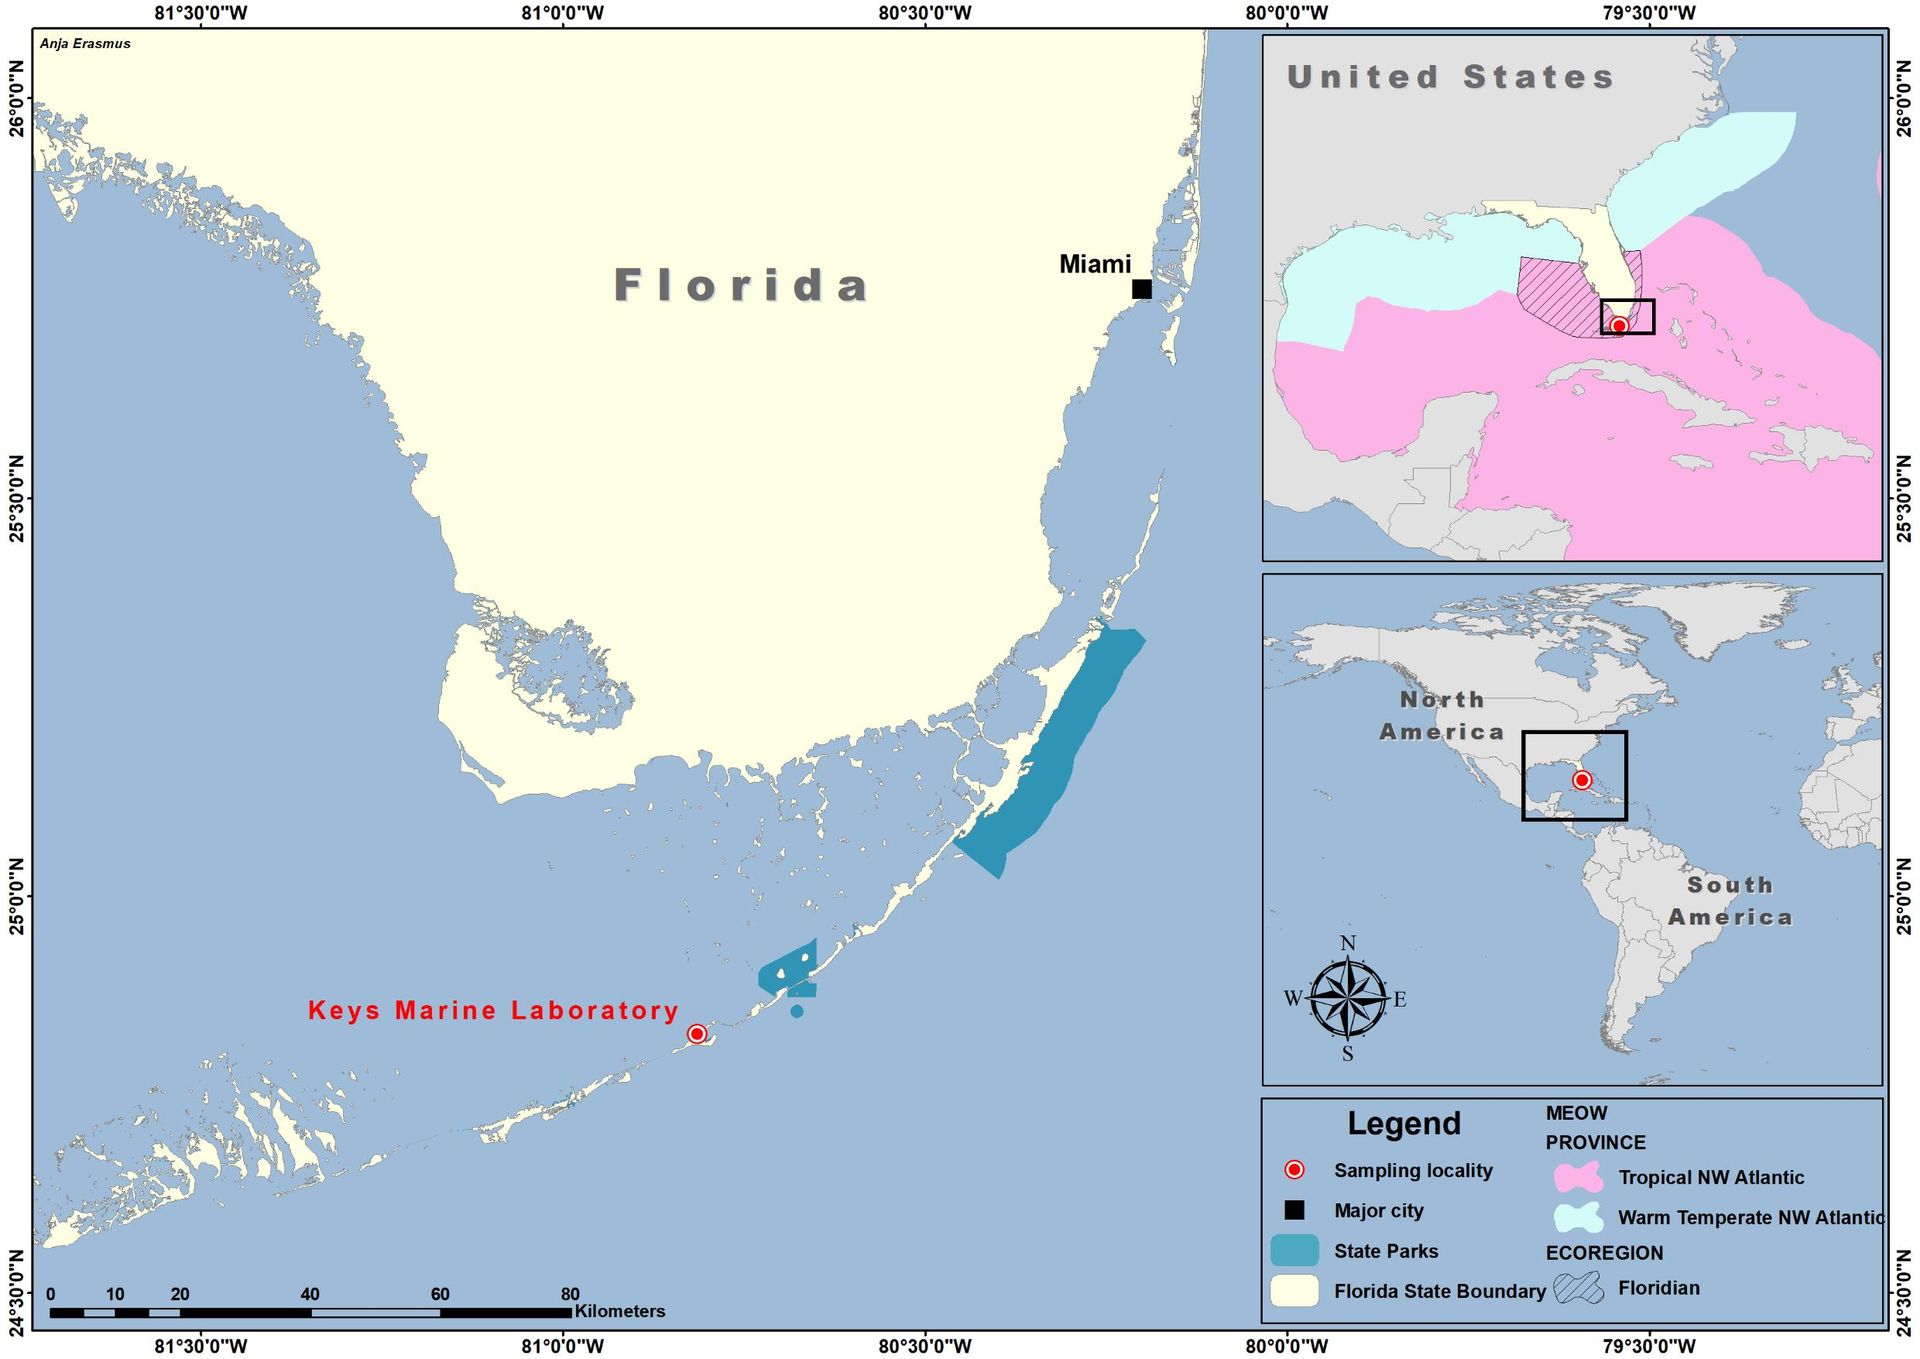
Study area maps
Client: Researchers
Objective: To generate study area maps for
publication, serving more than 15 researchers, by delineating sampling
locations and providing essential insights into land use activities,
conservation zones, ocean currents, and other relevant information to support
research findings.
Outcomes:
- Generated over 30 publication-ready study area maps
- Accurately integrate information on sampling locations to support data collection and analysis into clear visuals
-
Improved the clarity and impact of research findings through
high-quality cartographic outputs
References
Here is a list of some references where these illustrations were used:
Erasmus A., Hadfield K.A., Sikkel P.C., Smit N.J. (2023) Morphological description and molecular characterization of Gnathia jimmybuffetti n. sp. (Crustacea, Isopoda, Gnathiidae): the first new Florida gnathiid in 100 years. Bulletin of Marine Science 99(3):353–375. https://doi.org/10.5343/bms.2023.0040